Welcome to my crypto market report for November 30, 2022.
On this site, I review the trend and performance of the crypto market on a 7-day and 30-day basis.
This report provides a color chart to help readers quickly get a sense of market direction for the short and intermediate time frames.
I also provide other analyses to add context to current market conditions.
If you like the report, please share it and follow me on Twitter and Instagram.
By following me on my socials, you can get notified when a report or update is made available on the site.
COLOR LEGEND
GREEN = BULLISH. For trend analysis, the metric is higher both on a 7/14/30 day and 2-day basis. This is a bullish indication, as the metric has displayed sustained upward movement.
YELLOW = MILDLY BULLISH. For trend analysis, the metric is higher on a 7/14/30 day basis but lower on a 2-day basis. This is a mildly bullish indication, as the metric has been in an upward trend but is showing signs of weakness.
BLUE = MILDLY BEARISH. For trend analysis, the metric is lower on a 7/14/30 day basis but higher on a 2-day basis. This is a slightly bearish indication, as the metric has been in a downward trend but is showing signs of strength.
RED = BEARISH. For trend analysis, the metric is lower both on a 7/14/30 day and 2-day basis. This is a bearish indication, as the metric has displayed sustained downward movement.
MARKET REPORT
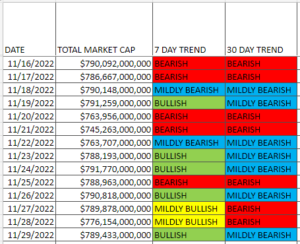
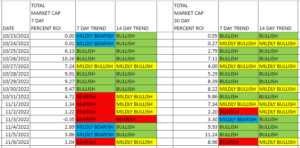
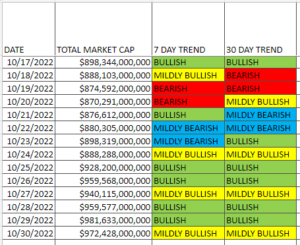
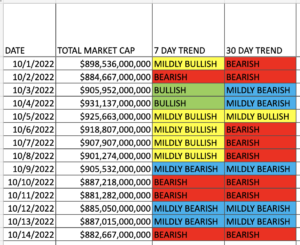
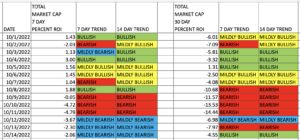
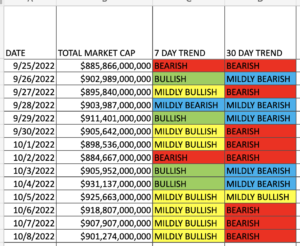
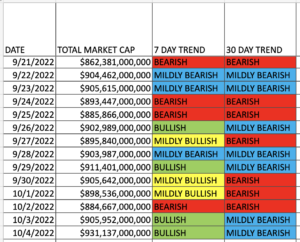
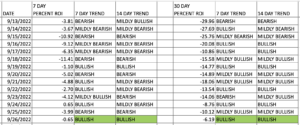
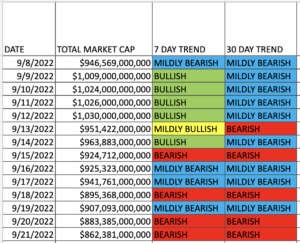
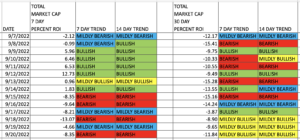
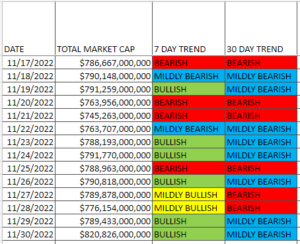
TREND OF TOTAL CRYPTO MARKET CAP
- Short term (7-day) trend: BULLISH
- Intermediate term (30-day) trend: MILDLY BEARISH
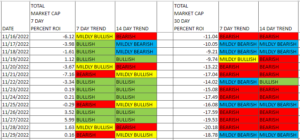
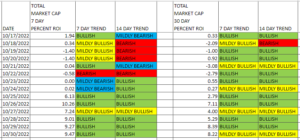
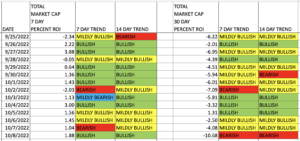
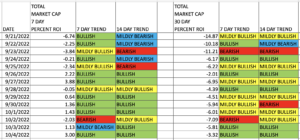
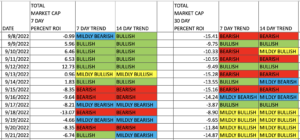
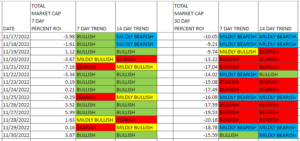
TOTAL CRYPTO MARKET PERCENT ROI
These metrics measure market performance by calculating the percent change of total cryptocurrency market cap over a 7-day and 30-day period.
Short term (7-day) percent ROI: +3.67%
- Best trend score: BULLISH
Intermediate term (30-day) percent ROI: -15.59%
- Best trend score: BULLISH
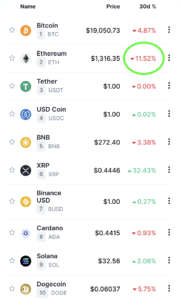
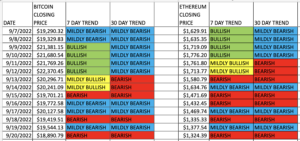
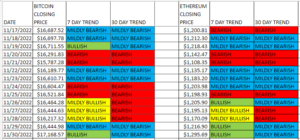
BITCOIN AND ETHEREUM
Bitcoin and Ethereum are the two largest cryptocurrencies by market cap, so they have a major influence on the direction of the cryptocurrency market. In addition, it is a widely held notion that any consideration of other cryptocurrencies should come with the expectation that they outperform Bitcoin, Ethereum or the total cryptocurrency market. Hence, I also provide analysis on Bitcoin and Ethereum in this report.
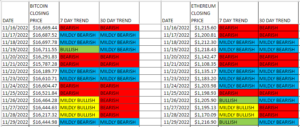
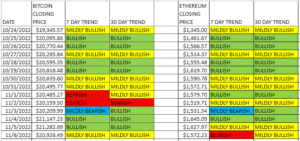
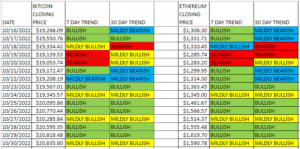
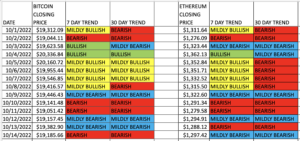
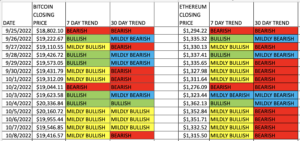
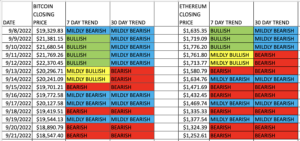
TREND OF BITCOIN AND ETHEREUM
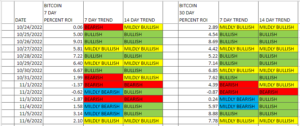
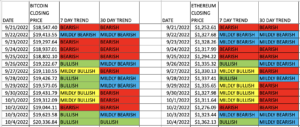
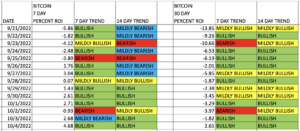
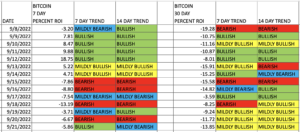
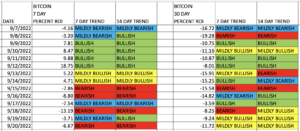
Bitcoin
- Short term (7-day) trend: BULLISH
- Intermediate term (30-day) trend: MILDLY BEARISH
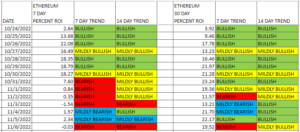
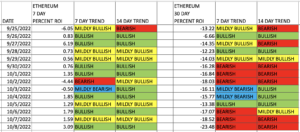
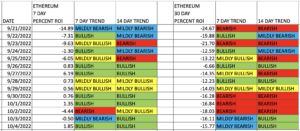
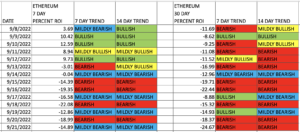
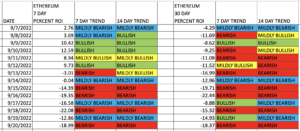
Ethereum
- Short term (7-day) trend: BULLISH
- Intermediate term (30-day) trend: MILDLY BEARISH
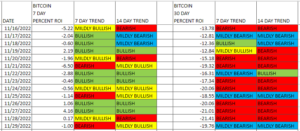
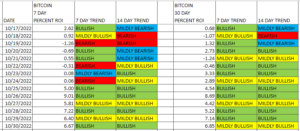
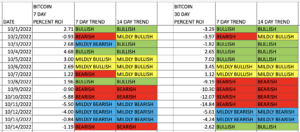
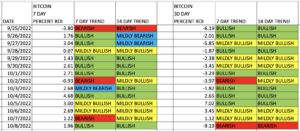
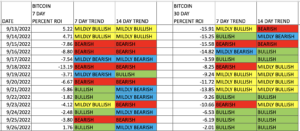
BITCOIN PERCENT ROI
Short term (7-day) percent ROI: +3.40%
- Best trend score: BULLISH
- Status: underperforming total crypto market, underperforming Ethereum
Intermediate term (30-day) percent ROI: -16.19%
- Best trend score: BULLISH
- Status: underperforming total crypto market, outperforming Ethereum
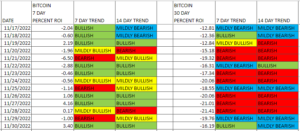
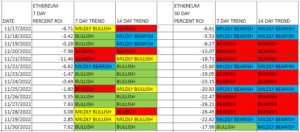
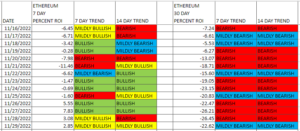
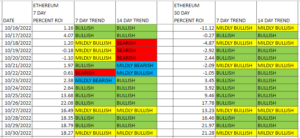
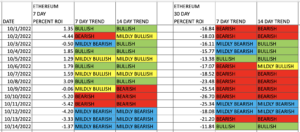
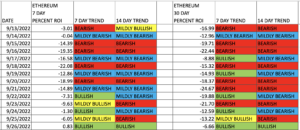
ETHEREUM PERCENT ROI
Short term (7-day) percent ROI: +7.62%
- Best trend score: BULLISH
- Status: outperforming total crypto market, outperforming Bitcoin
Intermediate term (30-day) percent ROI: -17.98%
- Best trend score: BULLISH
- Status: underperforming total crypto market, underperforming Bitcoin